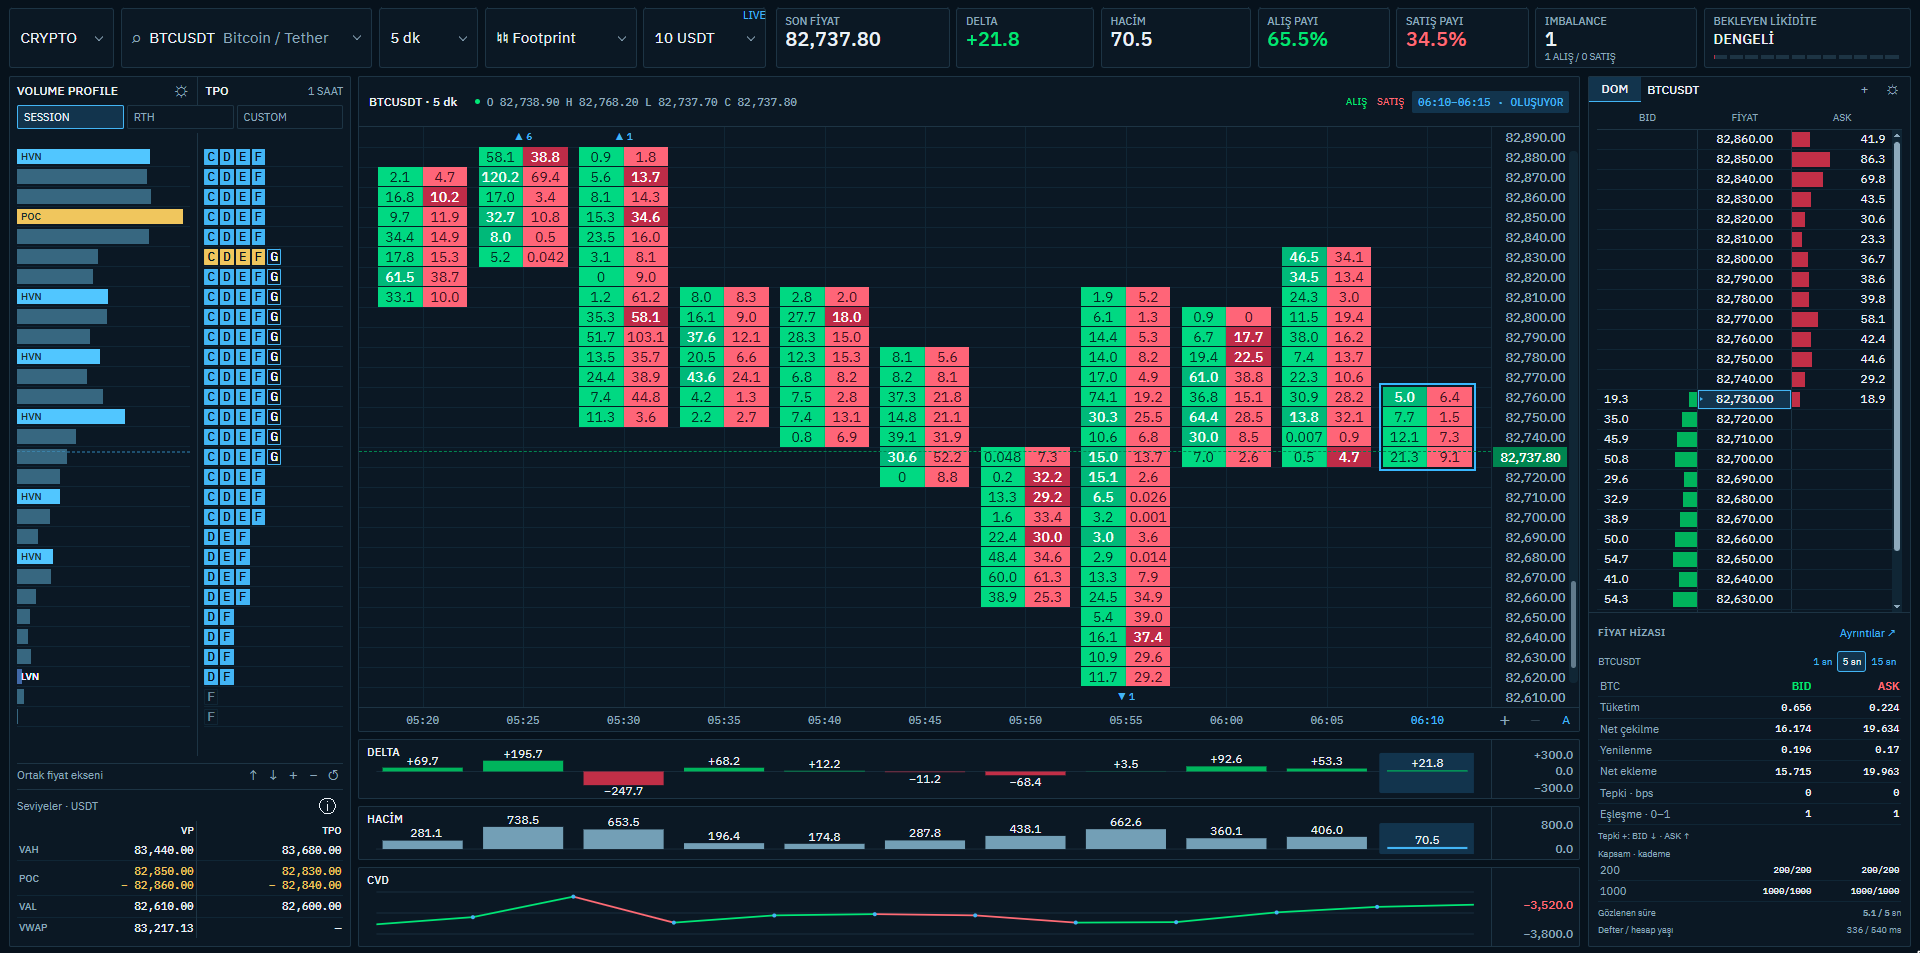
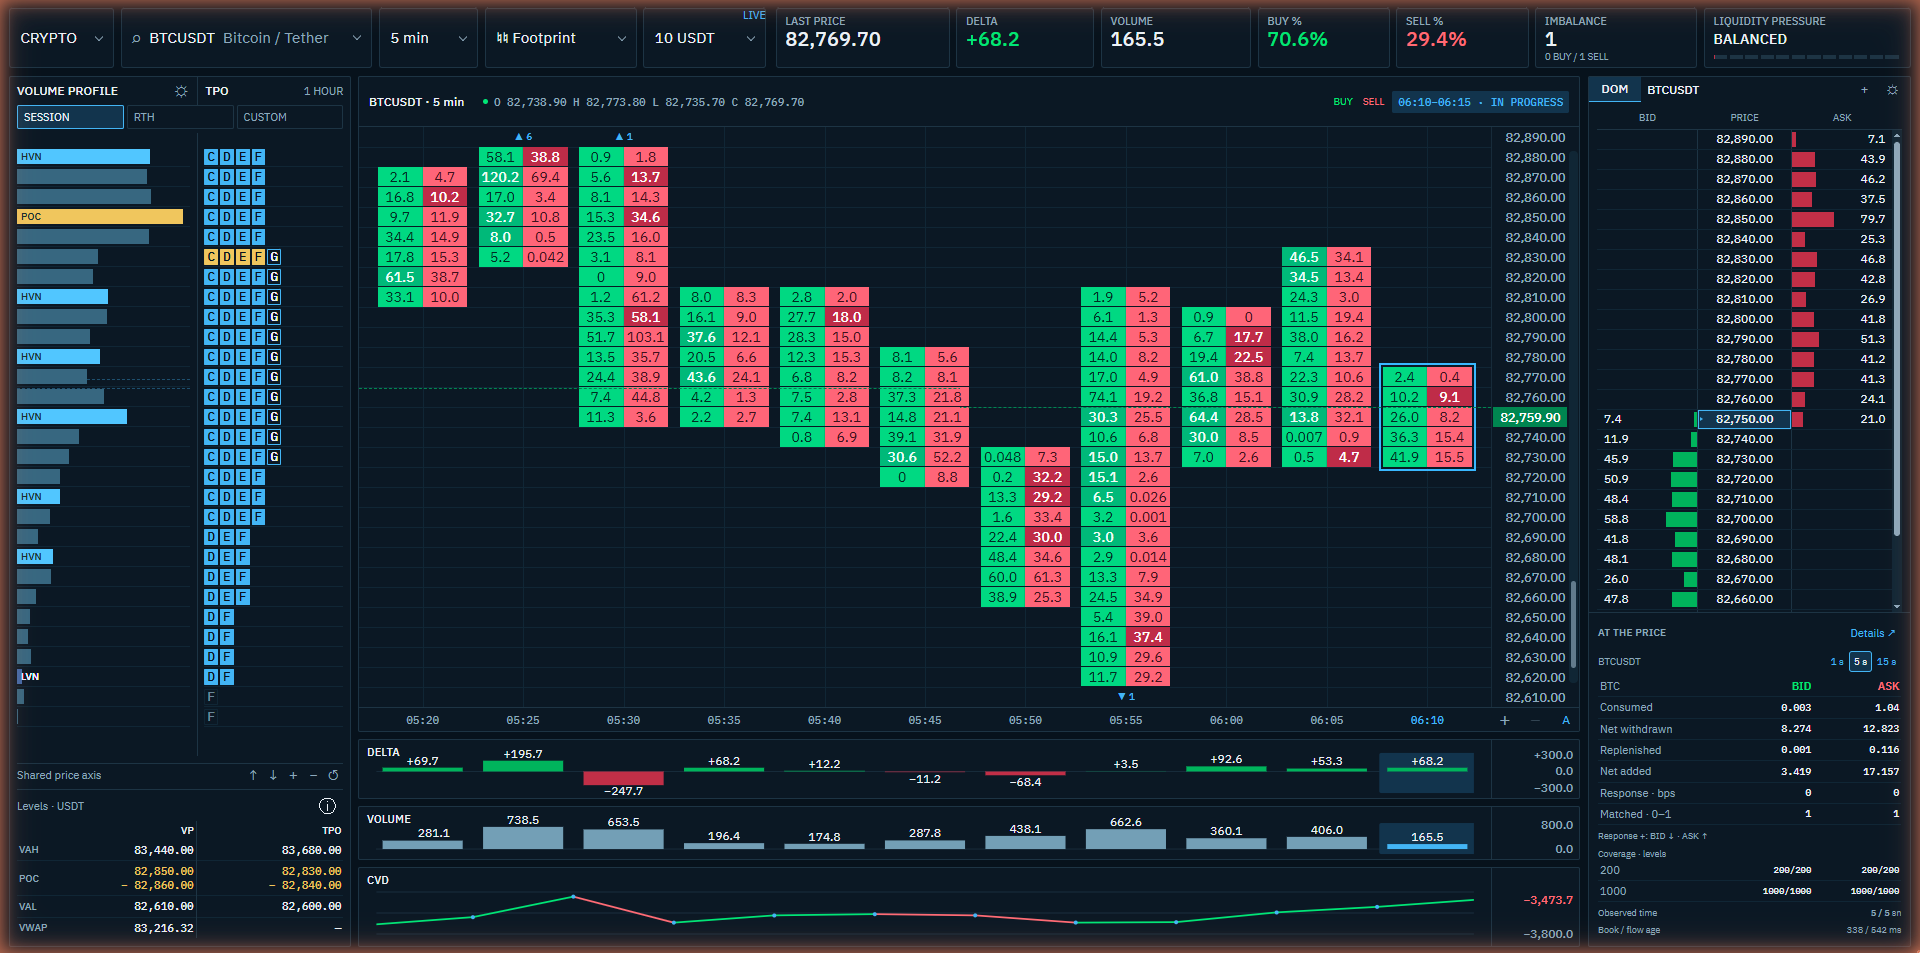
Everyone sees the price. You see beyond it. On one screen.
In Quantsion Terminal, see nineteen measures of the market's direction and the force behind it on one screen: across five markets, on the 5, 15, 30 and 60-minute horizons, each with its change from the previous minute. The measures are renewed every minute, so you can notice which measure is changing, and on which horizon the change began, before it reaches price.
MONITOR · MARKET STATE
Understand the market state at a glance.
Quantsion turns the results of advanced quantitative analysis into clear measurements that make decisions easier. This lets you grasp the situation as a whole, at a glance.
ANALYZE · EVIDENCE
See the evidence behind the measurement.
In Quantsion, every measurement opens into the readings that support it, contradict it or remain unmeasured. This lets you judge for yourself what a state rests on and how strongly it is supported.
Terminal benefits
01See conditions form earlier.
Instead of bringing together and interpreting fragmented market data yourself, Quantsion continuously evaluates changing market and instrument conditions to make developing conditions visible earlier. This gives you more time to understand what is forming, assess its potential and decide how to respond.
02Decide faster. With clarity.
Quantsion reduces the time and effort required to evaluate a situation by bringing the relevant analysis together in one workspace. Instead of researching multiple sources and interpreting each element separately, you receive a focused assessment that helps you reach a decision faster and with greater clarity.
03Reduce emotion. Increase consistency.
Market decisions can be influenced by emotion, stress, fatigue, recent gains or losses, and personal bias. Quantsion evaluates every situation through the same systematic quantitative process each time, providing a consistent assessment, the same under every emotional condition. This helps reduce subjective variability and gives you a more stable basis for decision-making.
BTCUSDTETHUSDTBNBUSDTSOLUSDTTRXUSDTIllustrative data · 14:32:00 UTC · method v3.2 · digest 8f2c…41a1
BTCUSDTUSDT perpetual
HORIZON5 min15 min30 min60 min
MARKET REGIMEUptrend · expanding volatility42 min · since 13:50STRUCTURE1h 63 400defended twiceCOVERAGE82 / 82
MEASURE
5 MIN
15 MIN
30 MIN
60 MIN
P30D
TRACE
STATE
Direction±1 · + up
−0.38 ▼.01
−0.22 ▲.02
+0.15 ▲.04
+0.22 ▼.02
p28
Down
Trend strength±1 · + up
+0.68 ▼.10
+0.52 ·.00
+0.29 ▲.04
+0.12 ▲.03
p91
Up
Volatility ±1 · 0 normal
+0.46 ▲.11
+0.31 ▼.03
+0.12 ·.00
−0.02 ▲.01
p75
High
Flow pressure±1 · + buying
+0.62 ▲.11
+0.48 ▲.15
+0.31 ▼.01
+0.12 ▲.01
p88
Buying
Flow–price response±1 · + price follows
+0.07 ·.00
+0.21 ▲.04
+0.27 ▲.08
+0.15 ▼.01
p65
Neutral
Absorption 0–1
0.72 ▲.07
0.55 ▲.09
0.39 ▼.01
0.30 ·.00
p85
Ask side
Price discovery 0–1
0.35 ·.00
0.24 ▲.01
0.26 ▲.02
0.31 ·.00
p25
Fragile
Order book pressure±1 · + bid side
+0.50 ▲.16
+0.23 ▼.01
−0.20 ▲.02
−0.45 ▲.11
p76
Bid side heavy
Fair value 0–1
0.45 ▲.04
0.48 ▼.04
0.47 ·.00
0.45 ▲.03
p83
Pull down
Liquidity 0–1
0.62 ▼.05
0.56 ▲.01
0.40 ▲.02
0.31 ▲.02
p64
Moderate
Execution cost±1 · + expensive
+0.51 ▲.14
+0.68 ▼.06
+0.57 ▲.03
+0.09 ▲.02
p94
Expensive
Flow toxicity 0–1
0.68 ▼.01
0.54 ▲.03
0.42 ▲.04
0.37 ▼.01
p72
Moderate
Derivatives direction±1 · + up
+0.62 ▲.21
+0.61 ▼.01
+0.60 ▲.07
+0.33 ▲.09
p93
Up
Positioning±1 · + long crowded
+0.58 ▼.07
+0.43 ▲.01
+0.26 ▲.04
+0.11 ▲.03
p77
Long crowded
Leverage cycle±1 · + build-up
+0.53 ▲.04
−0.07 ▲.02
+0.33 ▼.05
+0.40 ·.00
p36
Neutral
Carry stress 0–1
0.47 ·.00
0.54 ▲.04
0.65 ▲.11
0.46 ▼.02
p84
Long tension
Squeeze pressure 0–1
0.66 ▲.04
0.33 ▲.02
0.19 ▼.01
0.13 ·.00
p54
Moderate · short
Momentum exhaustion 0–1
0.40 ▼.01
0.42 ▲.01
0.35 ▲.02
0.22 ▼.01
p86
High
Reversal pressure±1 · + up
−0.65 ▲.01
−0.52 ▲.08
−0.32 ▲.10
−0.17 ▼.01
p8
Down
Δ against the previous minute · percentile over the 30-day distribution · trace: the selected horizon over the last 60 min · an unmeasured cell stays empty and names its reason · a cell opens its evidence in AnalyzeEvidence → Analyze
ANALYZE · EVIDENCE
LiquidityBTCUSDT · 15 min · Uptrend · expanding volatility
Dependent groups A: measures from one source count once · support share 1.00 · conflict share 0.00 · coverage 3 / 3 · method v3.2 · digest 8f2c…41a1← Monitor
FLOW · ORDER FLOW
01
SEE CONDITIONS FORM EARLIER.
Instead of bringing together and interpreting fragmented market data yourself, Quantsion continuously evaluates changing market and instrument conditions to make developing conditions visible earlier. This gives you more time to understand what is forming, assess its potential and decide how to respond.
02
UNDERSTAND THE MARKET STATE AT A GLANCE.
Quantsion turns the results of advanced quantitative analysis into clear measurements that make decisions easier. This lets you grasp the situation as a whole, at a glance.
03
SEE THE EVIDENCE BEHIND THE MEASUREMENT.
In Quantsion, every measurement opens into the readings that support it, contradict it or remain unmeasured. This lets you judge for yourself what a state rests on and how strongly it is supported.
04
DECIDE FASTER. WITH CLARITY.
Quantsion reduces the time and effort required to evaluate a situation by bringing the relevant analysis together in one workspace. Instead of researching multiple sources and interpreting each element separately, you receive a focused assessment that helps you reach a decision faster and with greater clarity.
05
REDUCE EMOTION. INCREASE CONSISTENCY.
Market decisions can be influenced by emotion, stress, fatigue, recent gains or losses, and personal bias. Quantsion evaluates every situation through the same systematic quantitative process each time, providing a consistent assessment, the same under every emotional condition. This helps reduce subjective variability and gives you a more stable basis for decision-making.